RWA16: Industry Insights from Data Guy and More
The Romance Writers of America organization is known by writers of all genres for providing professional education opportunities. While at the National Conference the other week, I met several writers who have only “romantic elements” (or less) in their stories and yet participate in RWA because of those opportunities.
This year, for the first time, I attended the RWA conference as a member of PAN, the Published Author Network. At the conference, PAN members are eligible to attend special published-authors-only workshops geared toward those with more experience.
Several of the PAN workshops focused on numbers, industry analysis, and market forecasts. Yes, lots of math for my not-math-oriented brain. *smile*
But I want to share some of the highlights from those workshops because I know even most RWA16 attendees didn’t get to see them (much less those that didn’t go to the conference). While these workshops were focused on the romance genre, I think we can all benefit from many of the insights.
Highlights from Data Guy
For those who aren’t familiar with Data Guy, let me back up…
In 2014, Hugh Howey, the successful self-published author of Wool, teamed up with an anonymous database expert (who became known as Data Guy) to provide reports on ebook sales based on scraping information from Amazon’s public sales pages for ebooks. They’ve now compiled several of these reports on their website, Author Earnings.
As Hugh said in the introduction of the first report:
“It’s no great secret that the world of publishing is changing. What is a secret is how much. … Distributors like Amazon and Barnes & Noble don’t share their e-book sales figures.
This lack of data has been frustrating. … I have longed for greater transparency so that up-and-coming authors can make better-informed decisions. …an author with advanced coding skills…created a software program that can crawl online bestseller lists and grab mountains of data. … And now we finally have some answers.”
Data Guy himself came to RWA National to present findings from his analysis of the romance genre. (Yes, I’ve met Data Guy in person—he really exists.)
Data Guy specifically looked at the romance genre because it sells strongly in the digital format and, as many self-published authors will agree, Amazon is responsible for most of the sales. In other words, the romance genre lines up with his most successful data-scraping techniques.
(The data in his report focuses on Amazon U.S. Kindle sales, not other retailers, international Amazon stores, print/audio, etc.)
According to his data, over 50% of U.S. Romance sales are of self-published titles, and 67% aren’t tracked by traditional metrics (such as Nielsen/BookScan, which we’ll get into below).
Now, much can be argued about the validity of his data collection methods (and thus their accuracy for analysis), but the same can be said for the numbers that came out of the Nielsen presentation (which I also attended and was less impressed by). So rather than arguing about whether a number should be 58% and not 67%, etc., I want to look at some of the big picture highlights I picked up from Data Guy’s presentation.
(I recommend looking through his presentation for more details. I’ll be touching on only some of the points here.)
Kindle Unlimited Titles Might Outperform
His analysis covers only one day of data, but on that day, while 1/3 of the titles were in Kindle Unlimited (the exclusive-to-Amazon-Kindle-Select option), those titles accounted for 1/2 of the Kindle sales earnings.
(Note to newsletter readers: Click through to today’s post to see all the images, or just check out Data Guy’s presentation slides linked above. Click on the images themselves to see full-size.)
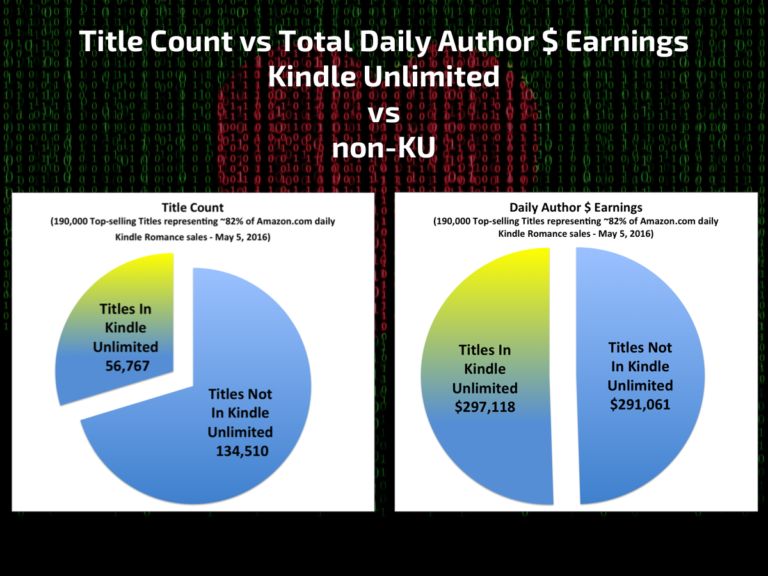
Romance titles on KU earn nearly two and a half times as much as non-KU romance titles, but of course, the consequence is the requirement to be exclusive to Amazon. (Earnings from other retailers aren’t captured here, but if they were, that money might help balance the second pie chart from those non-KU authors’ perspectives.)
Data Guy observed that many authors with larger catalogs mix and match, with some titles in KU and some non-exclusive, in order to get the best of both worlds.
Again, I don’t want to get into arguments over the specific numbers, but I think we can take away this lesson:
As we increase our backlist, we might want to revisit our decision of whether or not to enroll in KU, perhaps enrolling some titles and not others.
Self-Published Titles Might Perform Better over Time
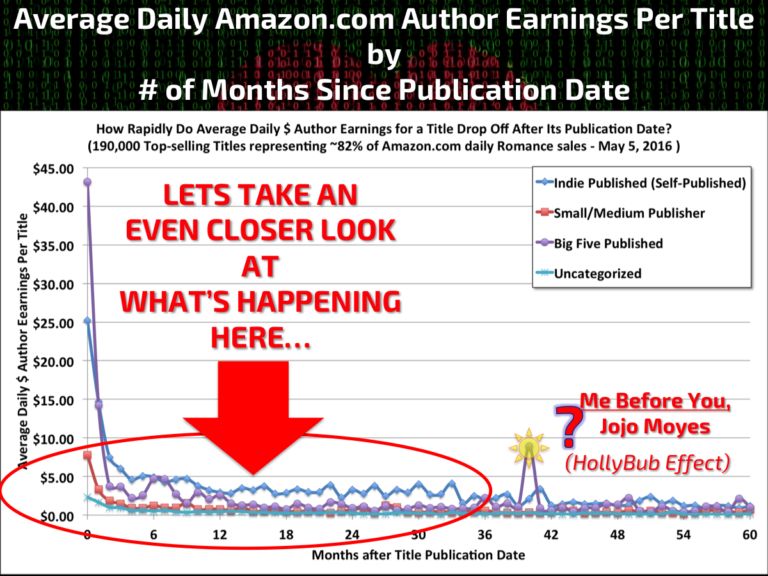
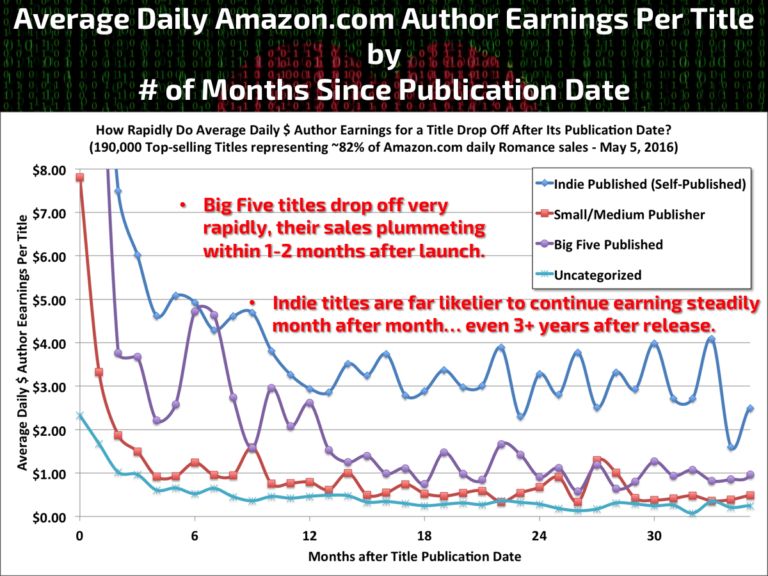
“Long tail” is a sales term to describe how well a product continues to sell over time. Data Guy discovered that while traditionally published romances sell well in their first month, they tend to drop off significantly in later months, especially when compared to self-published titles.
In the first month, traditionally published romances average earnings of $43/day, and self-published romances average $25/day. However, by the second month, their earnings are neck and neck, and from the third month on, self-published titles earn about twice as much as traditionally published romances.
One thing to know about statistics is that correlation isn’t the same as causation. (Just because there’s a connection between two facts doesn’t mean one causes the other.)
Yes, self-published books make more money over the long tail, but is that because they’re self-published? Or just because self-published authors are *cough* smart enough to not let their backlist catalogs languish, as so many traditional publishers do?
(If you’re looking at the full presentation, note that while the Amazon-Imprint books look really good in comparison in the full chart for this breakdown, Data Guy suspected that was heavily influenced by their low number of releases and not necessarily significant.)
No matter how we publish, I think we can take away this lesson:
If we’re traditionally published, we can ask our publisher about their long-tail sales plan, and regardless of our publishing path, we can promote our full backlist and see results.
Authors Might Not Need to Be Release Machines
Now we’re getting to some of my favorite slides. However, these can be very confusing on their own without Data Guy’s explanation, so I’ll try to clarify the information, but feel free to ask questions in the comments.
We’ve probably all heard that to be successful, we need to release multiple books a year. For a slow writer, the advice to release once a quarter (or even more frequently) can be cause for outright panic.
Logically, we know that the more titles we have out, the more opportunities readers have to discover our books. But is there a point of diminishing returns?
Perhaps a too-frequent release schedule burns out readers? Or intimidates new readers from digging in? Or maybe a too-big catalog indicates (in truth or in reader-impression) poor editing?
This first chart shows the earnings per title per day for our catalog size, which seems to show diminishing returns above 16 or so titles. What that means is that adding new titles will increase our earnings—because we are expanding our catalog—but the “halo” effect of each new release attracting new readers for our other titles might diminish.
(It’s also possible that the large catalogs of 20 or more titles are dominated by traditionally published authors who have been around forever to write all those books, and that their lower royalties are skewing the earnings data downward toward the right of the slide. Regardless, the leveling off between several of those buckets is telling.)

Keep in mind that romance readers are known as being voracious. It’s not unusual for a romance reader to inhale a book or more a week. So if the romance genre doesn’t require a double-digit backlist to succeed, other genres are likely even more forgiving.
This second chart is even more interesting to slow-writer me. *smile* While the chart above shows per title per day earnings based on our overall catalog size, this chart shows those earnings based on our release schedule.
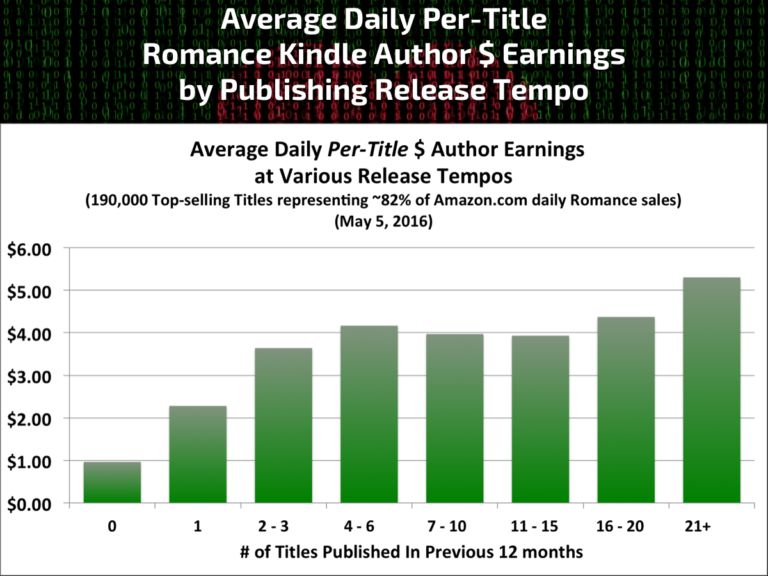
That is, if we haven’t released anything in the previous year, we’d fall into the zero bucket. There’s a big jump in earnings from zero to one release a year, and a similar jump from one release to two or three releases a year. After that…?
Again, each new release would add to our earnings—because we’re growing our catalog—but… The halo effect from a new release expanding our readership for our other titles levels off. Our income will increase the same for each new title whether we release it this year or next.
Personally, I think this is great news for those of us who don’t want to feel “guilty” about releasing too slowly. I can aim for a goal of one to three releases a year and still see the biggest impacts on my overall earnings.
I like the idea of not needing to stress ourselves out (or burn ourselves out) to maintain a multiple-releases-per-year schedule. (Says the woman who’s now suffering health effects from that quarterly schedule last year.) One to three releases a year to see the greatest jumps? That sounds more doable. *smile*
What lesson can we take away from this point?
Staying top-of-mind for readers with regular releases does help, but that doesn’t require a punishing release schedule—just one or two releases a year will still see most of the impact.
Data Guy includes even more information in the comments of his report, digging into the Mystery/Thriller/Suspense and Science Fiction/Fantasy genres and explaining more about how all of adult fiction is skewed toward ebook (which is why the standard tracking systems are close to worthless).
He also points out that averages are always influenced by the millionaire outliers. So “in the case of Romance Kindle sales, only 10% – 12% of the titles in each category are earning the average value shown or more.”
(One of the commenters on his site explores the surprising First-in-Series-Free results as well.)
Other Data Insights
Results from the Stanford Survey
Over the past few years, Christine Larson, a researcher at Stanford, has surveyed RWA members, and in a PAN workshop, she presented her findings. Here are a few of the highlights:
- Romance authors are more highly educated than the general population, and 35% of them write in other genres in addition to romance (non-fiction, other fiction and genres).
Underestimate them at your peril. *grin* - Over the same period of time, an Authors Guild survey showed author income declining from $6K to $2K per year, while the Stanford survey showed an increase from $4K to $7K.
Romance writers have been quicker than others to adjust to the changing publishing landscape and embrace entrepreneurship—learn from them. - SFWA and MWA, the science fiction and mystery writing organizations, refused to participate in a similar survey, as they’ve historically been more competitive and less open to sharing information than RWA.
In a gig economy, our network matters, and writing organizations that encourage education and support also help members stay on top of rapid industry changes.
And finally, this tidbit is huge:
- Unlike the earnings gap between traditionally published white authors and authors of color, among self-published authors, the racial earnings gap does not exist.
Gatekeepers are causing the racial earnings gap, not the market. Traditional publishers who claim the target market for diverse stories doesn’t exist are holding authors of color back.
Results from the Nielsen Romance Summary
Nielsen, the same company that tracks the popularity of TV shows, also tracks book sales. They sponsored an additional-fee, “Romance Summit” event the day before the PAN workshops, filled with information geared toward agents and publishers. However, they also gave a scaled-down summary of their findings to PAN authors the next day.
They purport to capture 85% of print sales with their BookScan data, but their ebook information (and thus, much of self-publishing) is spotty or non-existent. The claim during the Summit was “55% of the romance readership is buying their books in bookstores.”
By their own figures, that amounts to 28.5 million print books. By Data Guy’s figures, 174 million romance ebooks are sold on Amazon U.S. each year (not including the 61 million ebooks on other retailers). 28.5 compared to 235 is not 55%, so…? Even if Data Guy’s information isn’t quite right, it’s not off by that much.
(I sat a few chairs away from Data Guy during this presentation, and I wondered how hard he had to bite his tongue when the Nielsen presenter seemingly decided to arbitrarily add 25% to her figures to “account” for the missing ebook and self-published sales. His figures don’t include print sales beyond Amazon, but they showed over 89% of romance sales are ebook and 50% of romance sales are self-published. A teeny discrepancy, yes?)
Another reason I wasn’t impressed with the Nielsen data is that the presenter was excited about the growth in the trade paperback size of print books and was proposing that publishers should re-release mass-market paperbacks in that size to grab the “trend.”
Er, any self-published author could have told her that self-published print books are sold in the trade paperback size due to the print-on-demand options. So the “growth” is most likely attributable to self-published authors growing their print sales.
I try not to be a rah-rah self-publishing cheerleader because I know everyone’s goals and needs are different, but the Nielsen presentation felt like the last “no need to panic, traditional publishers!” gasp from those unable to see how much their data no longer speaks to reality.
That said, she did include interesting information about the future of the romance target market, especially when it comes to diversity. Most U.S. population growth comes from multicultural consumers, and 55% of women are interested in gender/sexual orientation diversity in their stories, with that percentage growing at each younger generation.
*whew* That’s my rundown of facts, figures, opinions, and insights from the PAN workshops at RWA16. Let me know if you have any questions about any of these presentations! *smile*
If you attended any of these workshops, did you come away with different impressions or insights? Do you disagree with any of my conclusions? Which of these insights was most interesting to you and why? Do you have any questions for me?
Pin It
Great post Jami, thank you.
Hi Kerry,
You’re welcome! Thanks for stopping by. 🙂
Greetings Jami,
Frickin’ Awesome Sauce!
As an IT guy, I totally understand and appreciate your post. Thanks so much. Am in the processing of re-Branding and building a Base, so there is a lot of information here to mine.
Thank you so much for taking the time to delve into the world of IT and statistics for us as it involves the writing industry.
Stay Well,
Donovan
PS: Still praying for your healthy full recovery. 🙂
Hi Donovan,
Good luck with your branding process–I hope this helps. And thank you for the good wishes! 🙂
Thanks, I shall read this again and digest it.
Main points I am taking are that it’s okay to turn out one to three ‘good’ books a year rather than aim for a novella a month like some talented folks.
And that:
“• Unlike the earnings gap between traditionally published white authors and authors of color, among self-published authors, the racial earnings gap does not exist.
Gatekeepers are causing the racial earnings gap, not the market. Traditional publishers who claim the target market for diverse stories doesn’t exist are holding authors of color back.”
This point was made at the last Octocon – an SF Con held in October 2015 in Dublin. A young lady author of colour from England was saying this and I stood up and told her and the room to self-publish.
That three “good” books has really taken a weight off my shoulders!
And it’s so funny. My first novella was just released by a small press, and they were surprised to find out that I’m black. It never came up, there was no reason for it to come up, and they didn’t know until I uploaded my picture on the author page the day of the release. I still titter about it. My goal is for hybrid publishing with this small press and self-pubbing.
Thanks for the insight Jami! One day soon I hope to be able to attend these conventions!
Hi Jayce,
Exactly! I felt the same way about the release schedule insights. 🙂
Good luck with your hybrid plan. One other factoid from the Stanford survey was that hybrid authors saw the highest incomes. Whether that’s a correlation or a causation, we can’t be sure, but it’s a good sign for you. 😀 Thanks for stopping by and sharing your story with your publisher–LOL!
Hi Clare,
Yes! Love hearing this point being reiterated at other venues. I’m so glad authors have options now to pursue success no matter what the gatekeepers think. 🙂 Thanks for sharing!
Thanks so much for sharing this, Jami! It is definitely reassuring to know that the benefits of multiple releases per year level off at around 3 or 4.
By the end of this year, I will have had 5 releases (one nonfiction, one novella, 3 novels), two of which were mostly written last year, but still, I am exhausted! Cannot Keep up This Pace…
Hi Kassandra,
Wow! I don’t blame you. I hope a more reasonable release schedule works well for both of us. 🙂 Good luck and thanks for stopping by!
Thanks so much for this great post, Jami! I really appreciate getting more details about these presentations and what the data means.
Hi Dana,
I’m happy to share! 🙂 As I mentioned, I know most people didn’t have access to this information, and even though Data Guy shared his slides, it still didn’t include the context behind some of the data. More information is always better in my book (probably why I can’t write short blog posts–LOL!). Thanks for the comment!
Wow!
Thank you for taking the time and writing a great post. I was surprised and happy to see the positive data on self-publishing, since I’m leaning in that direction. So glad you were eligible to sit in on this and bring it to the rest of us.
I’m going to get my hubby to read this. He’s an ex-IT who spent several years running data for a very large corporation, so he can appreciate the magnitude of the project.
Hi Dar,
It’s been tremendously interesting to watch the organization go from hostility toward self-publishing in 2010 to Stephanie Laurens’s eye-opening exploration of the new options in 2012 to a self-publishing workshop track in 2014 to now, where the attitudes of many assume that self-publishing might be superior in many circumstances rather than stigmatized.
Good luck with your choice and your writing! 🙂
Yeah, I’ve heard of Data Guy from the Author Earnings reports too! Their site is a fascinating read. 😀 Ooh I might try out Kindle Unlimited then (yeah, I keep changing my mind…) Oh man, for the point about a huge backlist making readers feel that the editing quality is poor…Yikes, I actually plan to publish all the books of a series together, so I’ll be able to change stuff in previous books if something changes in the later books. The story I’m editing right now is from a series that will probably have 7 books or more…It’ll look pretty funny to see 7 books having the same publishing date, but oh well. Oh gosh, I don’t even want to think about my (currently) 11 book long Chinese martial arts series (as well as their English translations). I seriously promise myself to take out the two stories within this story to make it look less intimidating. =_= And yeah, I have a sequel series to this story too. I also have several other series I haven’t finished writing, lol. It’s like I’m incapable of writing short stuff, haha. It might look uncanny for example if I have 7 books out (because I published them at the same time) but none of them have a review, haha. We’ll see how things go. “55% of women are interested in gender/sexual orientation diversity in their stories, with that percentage growing at each younger generation.” Nice!! As someone who is currently very obsessed with… — Read More »
Hi Serena,
Yes, interesting stuff, isn’t it? 🙂
And while it can be crazy-making to make all these decisions, the further I get into my journey, the more I realize that most of our decisions don’t have to be permanent. We can change our mind about our back-cover blurb book description, our cover, update front and back matter (even fix typos and the like), and reevaluate our KU choice every few months.
It can be either frustrating or freeing to realize that if something’s not working, we can change it. 🙂 Thanks for the comment!
Oh yeah apart from changing the whole manuscript I already uploaded, I’m going to change the cover AND author name. I plan to use my pen name Sieran Lane instead because it fits my personality (and nonbinary gender identity) more! Maybe I’ll need to change my Facebook name to Sieran Lane too, lol, but then I’ll have to explain to my parents (my mom and several relatives are on FB), argh. But at the very least, I’ll want to have links on my Facebook profile to my Amazon and Smashwords pages, and my author website when I finally make one.
Although I don’t write romance novels, I did find this extremely interesting.
Of note was this: “Unlike the earnings gap between traditionally published white authors and authors of color, among self-published authors, the racial earnings gap does not exist.”
That in itself is a motivator to go indie.
Thanks for sharing all of this valuable information.
Hi Mona,
It was striking to me how–far from the stigma self-publishing used to have–I heard more and more traditionally published authors interested in going hybrid and/or thinking self-publishing sounded preferable. The woman I sat next to for my Indie Book Signing (Susan Grant) was a traditionally published sci-fi romance author for years until issues with her publisher prompted her to pull back. Now, she’s self-publishing and loving it. 🙂 Good luck with your writing journey!
[…] time, I delved into some of the industry insights I picked up at the Romance Writers of America National Conference, and specifically, I shared results from three sessions that were open only to PAN (Published […]
I’m having trouble digesting the idea that “not needing to stress ourselves out (or burn ourselves out) to maintain a multiple-releases-per-year schedule” still means 2-3 books per year!! Y’all crazy! I’d love to get one per year and even that is dreaming big for my writing pace.
Hi Ashley,
I hear you! When I had my crazy release schedule last year, all those novels were drafted and just needed to go through editing. I’m mostly on a drafting-one-novel-a-year pace (hoping to improve that…), but remember that releases can also include short stories and novellas. 🙂
In his report, Data Guy didn’t separate out novel releases from shorter-form work. That release schedule was based on number of titles–of any length.
I hope that helps ease the digestion a bit. 😉 Thanks for bringing up that great question!
Jami,
I so appreciate you for delving into these statistics and bringing out more of the meaning for those of us in the romance writers community.
One key point I noted in reading Data Guy’s original report is that the KU results are skewed, as you mentioned, by the non-KU Authors other sales sites earnings not being reported. I know many authors who are making more on other sales sites than on Amazon.
Also, Data Guy breaks out an additional percentage of authors who aren’t trad, but aren’t listed as indie or small press–I’m not sure why he chose to do that, but if we lump them into indie, which is where they may truly belong, that makes the indie % of the pie bigger in all instances. I’m guessing the author co-op to which I belong would fall here, altho we are all truly indie authors. We’ve simply banded together to promote, get better ISBN prices, and the like.
thanks for your insights,
Cathryn Cade
Hi Cathryn,
Yes, he guessed that most “other” are actually self-published, either with their own imprint or with a co-op, such as what you have set up. So you’re right that those numbers would be even bigger! 🙂 Thanks for sharing that insight!